3. Analog Graphs
- When using simulation charts in Live mode, first configure the force measuring platform to ensure it functions properly. To use simulation charts in Edit Mode, load the cap data containing simulation channels and enable the force measurement table in the "Force Measurement Table Parameter Settings". Note: The digital force measuring platform does not support analog charts.
- Open "Analog Graphs" from the toolbar at the top of the software (11.3.1).
.png)
11.3.1
- Right-click on the chart and select "Edit Page". All channels will be displayed in the "Channels" panel floating on the left (11.3.2).
- Click the "Channel" button in the upper left corner of the list to select/deselect all simulation channels, and enable adaptation at the bottom of the panel.
- Double-click on "Maximum Rows" to change the number of rows displaying channels on the analog chart. The default number of rows is 6.
- Double-click on "Page Name" to modify the simulation chart name.
- Double-click on "Line Width" and enter numerical values in the input box to increase or decrease the thickness of the lines in the simulation chart.
- Click the + button above the simulation chart to add a simulation chart, or right-click on the Add page in the simulation chart to add a simulation chart.
- If there are multiple simulation charts that need to be deleted, please select the chart above the simulation chart and right-click on the delete page to delete the simulation chart. Alternatively, click the - sign button above the simulation chart to delete the chart. At least one simulation chart must exist, meaning the last simulation chart cannot be deleted.
.png)
11.3.2
- Multiple Columns Display: If the number of analog channels selected exceeds the set maximum number of rows, the additional channels will be displayed in the next column on the chart(11.3.3).
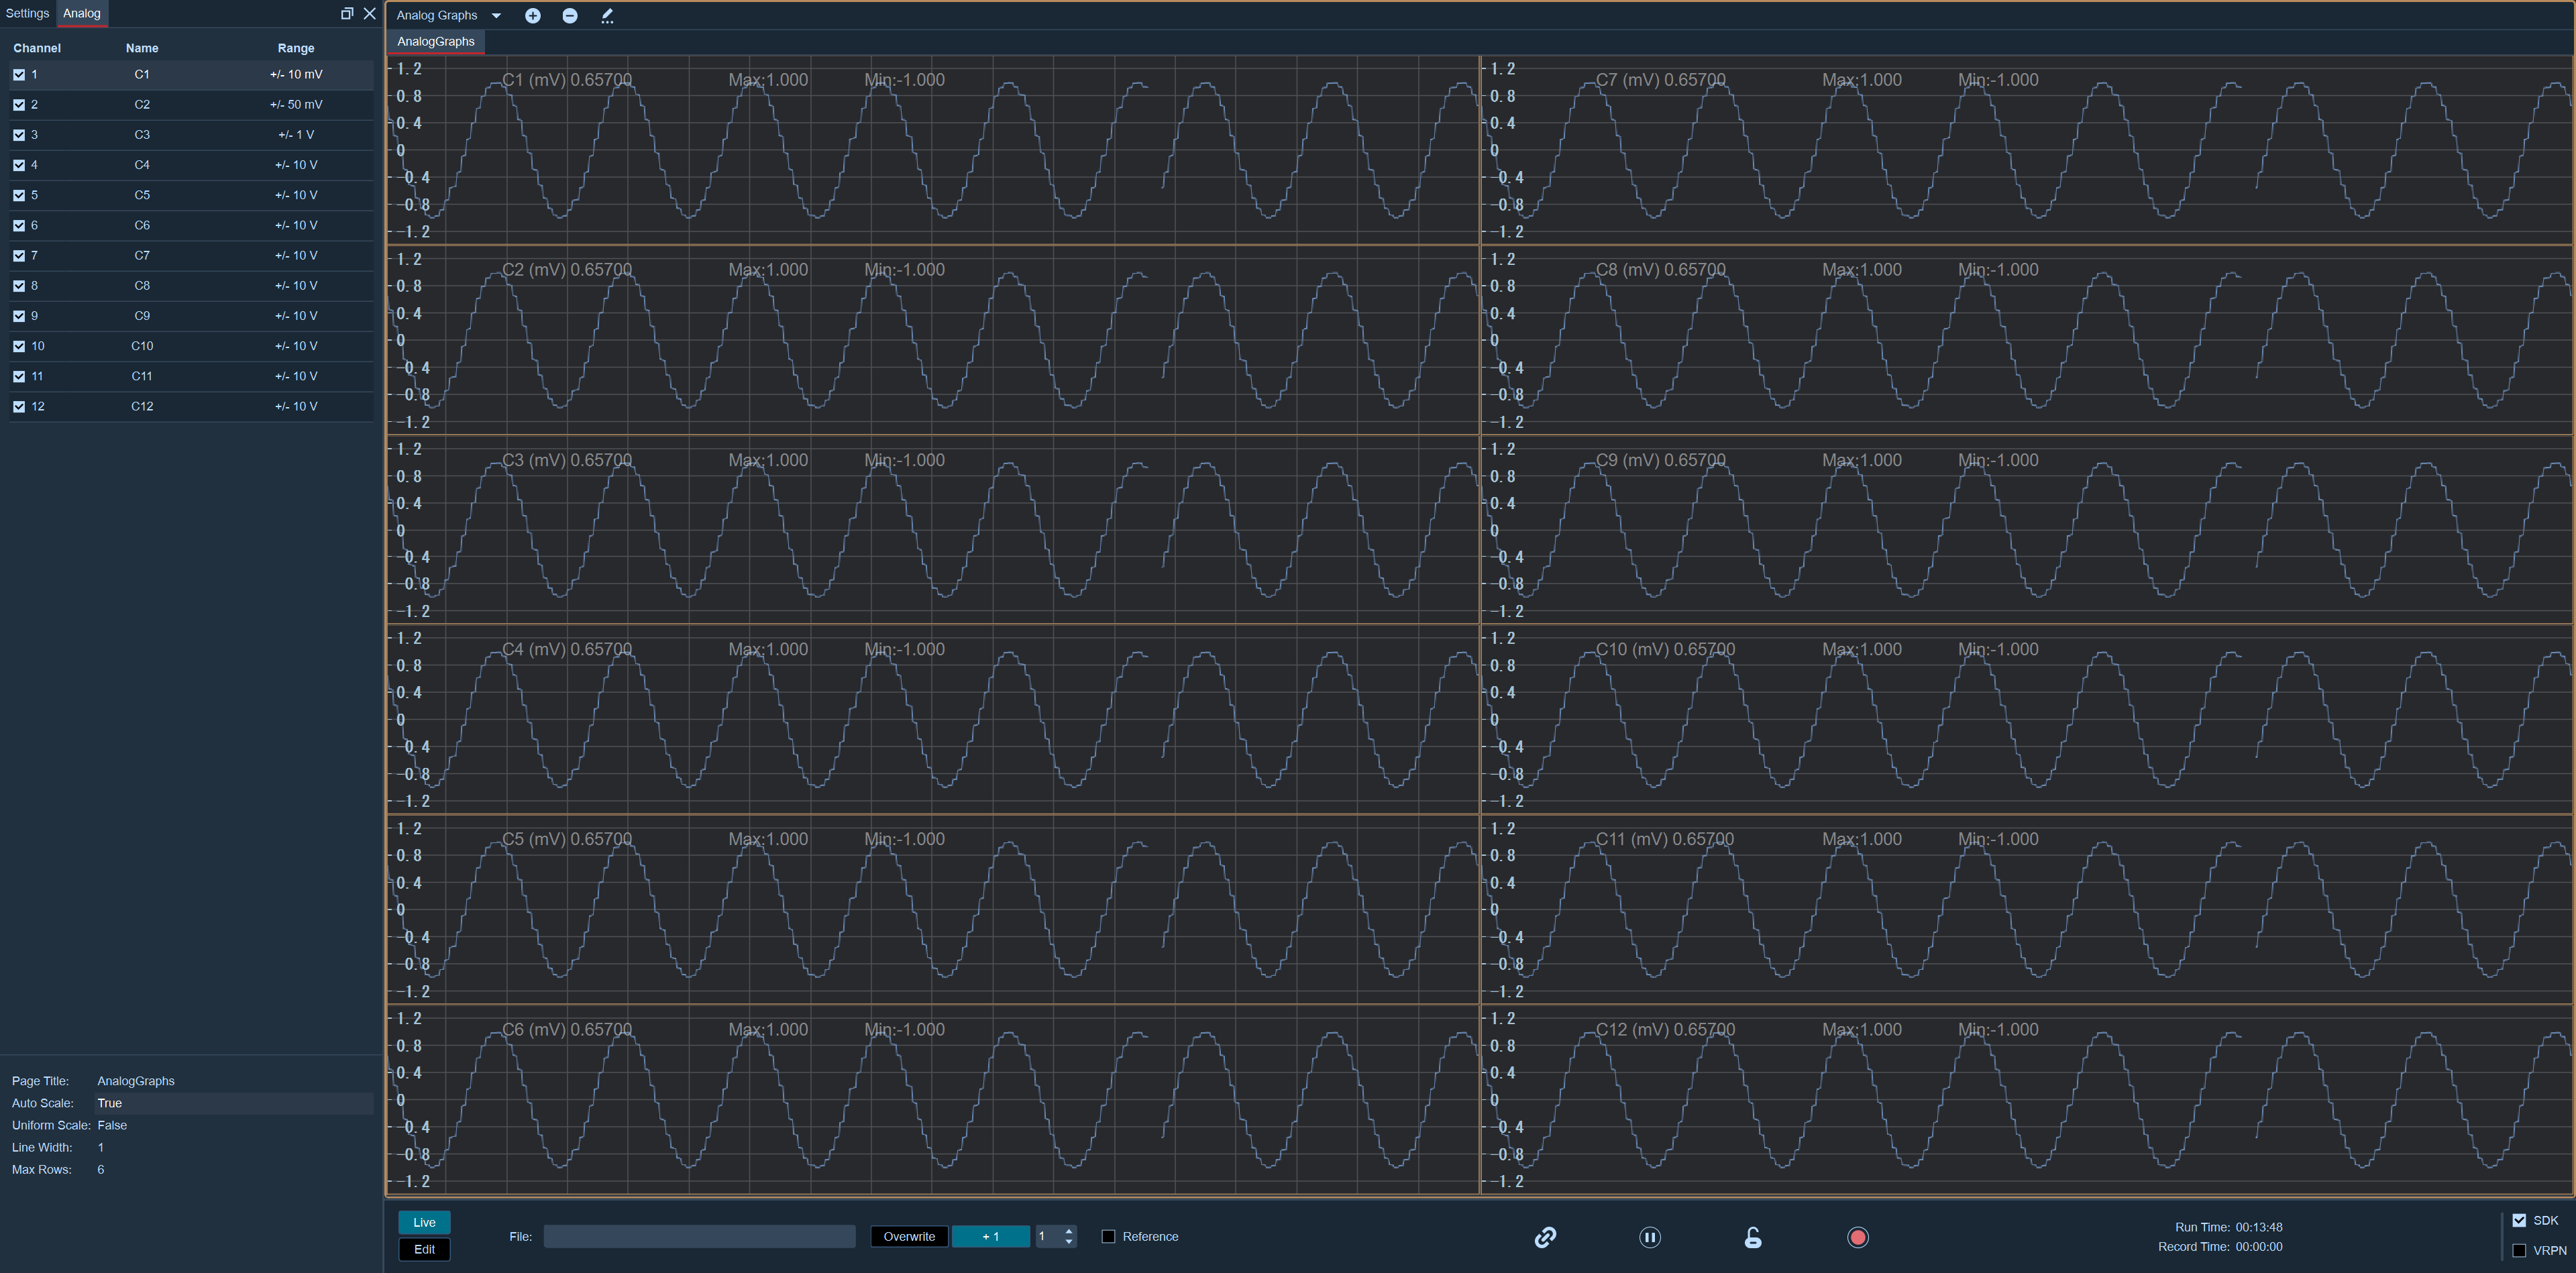
11.3.3